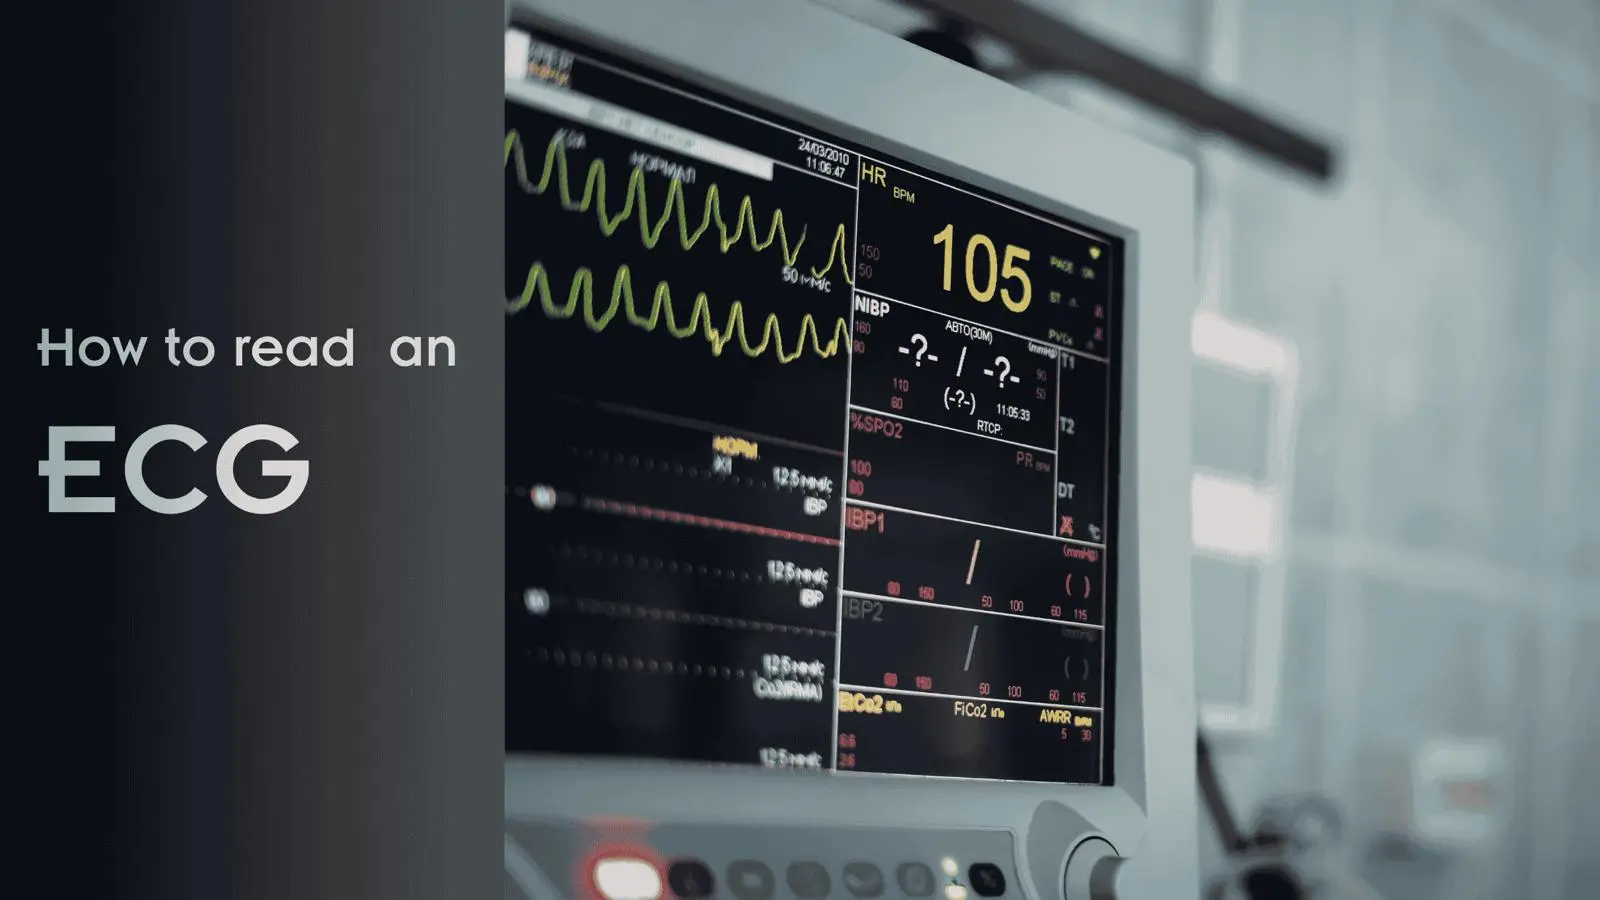
How to Read an ECG? 5 Easy Steps to EKG Interpretation
An electrocardiogram (ECG or EKG) is a quick, non-invasive test that records the electrical activity of your heart. It helps doctors assess heart rhythm, detect abnormalities, and identify potential cardiac conditions. While it may look complex at first, understanding an ECG is easier than it seems.
In this guide, you’ll learn how to read an ECG step by step, recognise the key components of the waveform, and understand the difference between a normal and abnormal ECG. Whether you’re a patient, student, or simply curious, this guide will help you interpret ECG results with confidence.
What is an ECG Test?
An electrocardiogram is a simple heart test that records the electrical activity of your heart and displays it as a waveform on a graph. This ECG graph depicts the whole story about your heart health, including rhythm, heart rate, and overall function.
There are 2 common types of ECG tests used:
4-Lead ECG: A 4-lead ECG uses four electrodes placed on the body to monitor heart rhythm. It provides limited views of the heart and is mainly used for continuous monitoring in ambulances or hospital wards.
12-Lead ECG: A 12-Lead EKG provides a comprehensive view of the heart’s electrical activity that a 4-Lead EKG may miss. It uses ten electrodes placed on the limbs and chest to record electrical views of the heart from 12 different angles, helping doctors diagnose conditions more precisely.
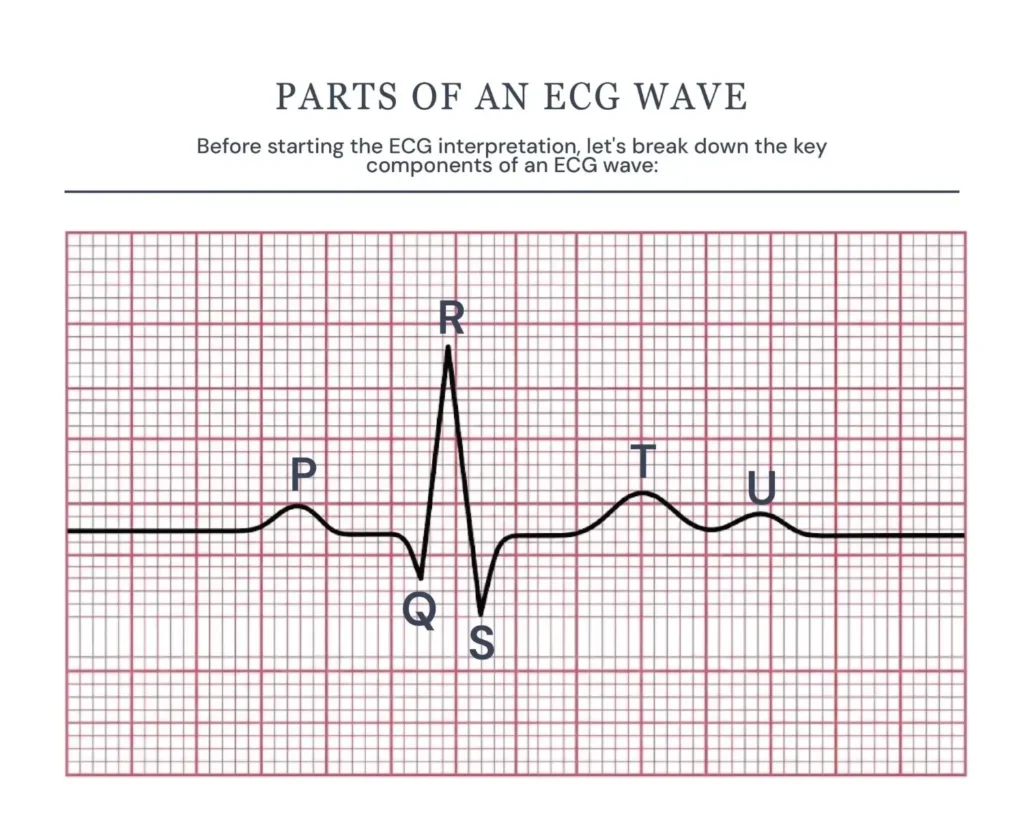
Understanding PQRST Waveform
Electrical activity of the heart can be picked up on the skin via electrodes. An ECG machine records these cardiac activities and displays them graphically as the heart’s electrical signals, voltages, and changes over time during a cardiac cycle.
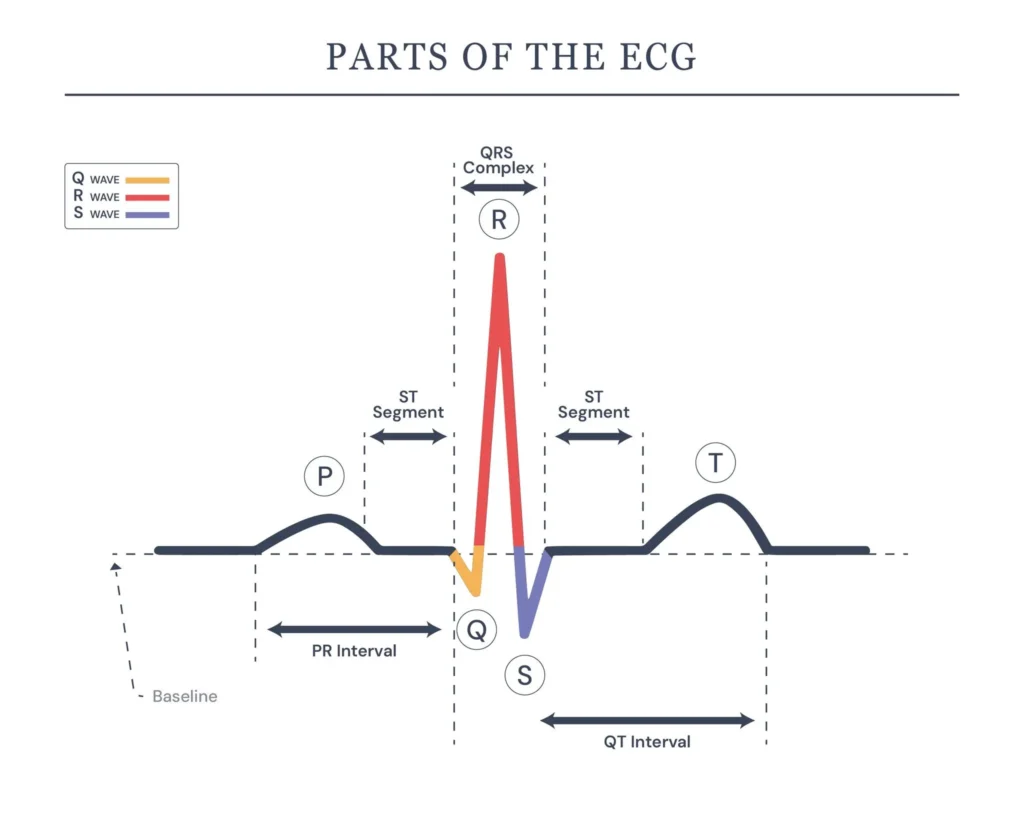
P-Wave
The P wave represents atrial contraction – the upper chambers of the heart, to push blood into the ventricles. In a normal ECG, the P wave is small and typically lasts between 0.06 and 0.12 seconds. Abnormalities in the P wave can provide important clues; for example, missing P waves may suggest atrial fibrillation, while unusually tall P waves can indicate atrial enlargement.
QRS Complex
The QRS complex represents ventricular contraction, when the lower chambers of the heart pump blood to the lungs and the rest of the body. It consists of three parts: the Q wave (a small downward deflection), the R wave (a tall upward peak), and the S wave (a downward dip following the R wave). In a normal ECG, the QRS complex typically lasts between 0.06 and 0.10 seconds.
T-Wave
The T wave represents the electrical resetting of the ventricles. In a normal ECG, the T wave is upright and usually follows the same direction as the QRS complex. Abnormal T waves can indicate underlying issues, such as an inverted T wave, which may suggest ischaemia, while a peaked T wave can be a sign of high potassium levels.
PR Interval
The PR interval reflects the time it takes for the electrical signal to travel from the atria to the ventricles. Normally, this interval ranges between 0.12 and 0.20 seconds. If the PR interval is prolonged, it may indicate an atrioventricular (AV) block, whereas a shorter-than-normal interval can suggest pre-excitation of the ventricles.
QT Interval
The QT interval represents the total time taken for the ventricles to contract and then reset. A normal QT interval typically falls between 0.36 and 0.44 seconds. A prolonged QTc, usually greater than 0.45 seconds, may increase the risk of arrhythmias.
Axes
The cardiac axis describes the direction of the electrical flow. A normal QRS axis generally lies between -30 ° and +90°. Significant deviations from this range, such as an axis less than -30°, may indicate underlying heart strain.
Difference Between an ECG and an Echocardiogram
A Quick Review for Normal and Abnormal ECG Waves
| Component of ECG Graph | Normal Range | Abnormality |
| Heart Rate | 60-100 bpm | Less than 60 bpm (Bradycardia), More than 100 bpm (Tachycardia) |
| P Wave | Shows Normal Pattern | Absent or shows an irregular Pattern |
| QRS Complex | Lasts between 0.06 and 0.10 seconds. | A wide QRS may indicate ventricular issues. |
| T Wave | Upright in most leads | Inverted or flattened |
| PR Interval | Lasts between 0.12 and 0.20 seconds. | Shortened or prolonged interval. |
| QT Interval | 0.35-0.45 seconds | A prolonged interval may indicate arrhythmia. |
How to Read an ECG? 5 Simple EKG Interpretation Steps
An ECG graph may look complex at first, but it becomes much easier to understand once you learn its key components. By recognising what each part of the waveform represents and how it differs from a normal pattern, you can gain valuable insights into your heart health. Here are five simple steps to help you read and interpret an ECG in an easy and structured way:
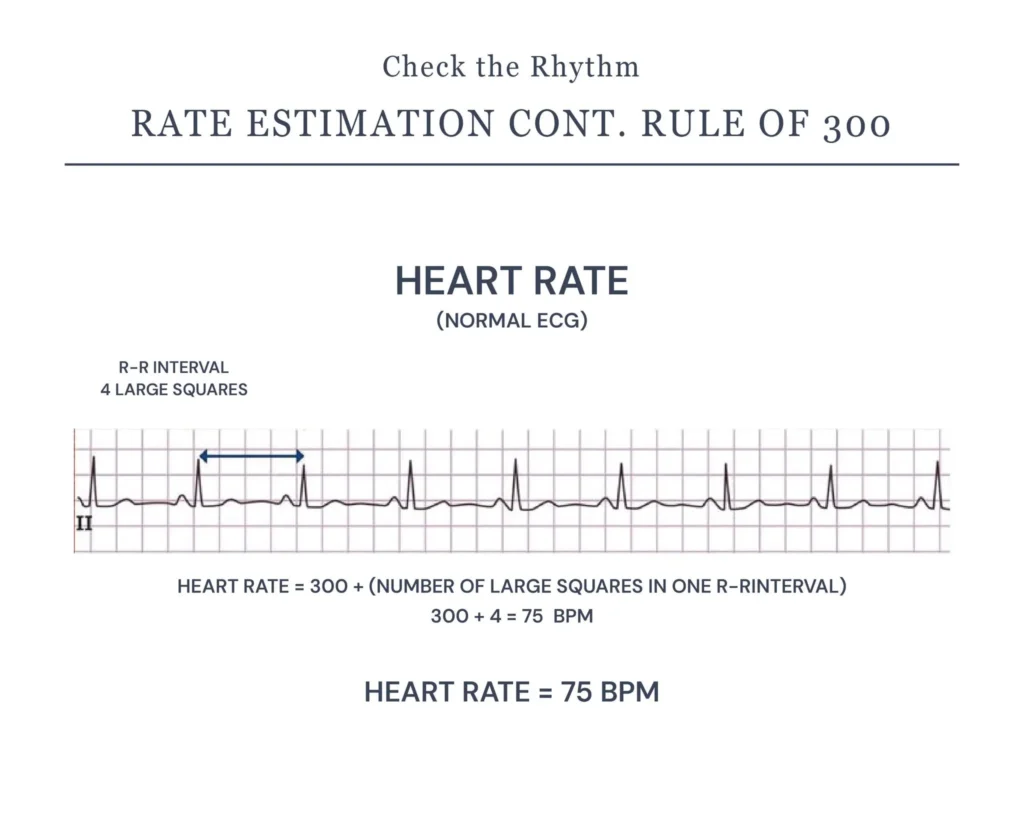
Understand the Heart Rate
Check the heart rate by counting the number of large squares between R waves and dividing 300 by that number to estimate beats per minute. For example, if there are 5 large squares between two R waves, divide 300 by 5. This gives a heart rate of 60 beats per minute, which is within the normal heart rate, i.e., 60 to 100 bpm.
Check the Heart Rhythm
Assess the rhythm by looking at the spacing between R waves. A regular pattern suggests a normal rhythm, while irregular spacing may indicate conditions such as atrial fibrillation. It is also important to check if each QRS complex is preceded by a P wave, which usually confirms a normal sinus rhythm.
Measure the Intervals
Measure the key intervals, i.e., PR, QRS, and QT intervals. These can be measured using a ruler or read directly from the ECG machine printout. Compare the intervals with the normal reference ranges to identify any abnormalities.
Evaluate the Cardiac Axis
The cardiac axis reflects the direction of the heart’s electrical activity. Positive QRS Complex in both lead I and aVF is generally considered normal, whereas a significant tilt towards left (<-30°)or right (>90°) may indicate underlying cardiac issues.
Point Out Abnormalities
Spot abnormalities in the ECG pattern. Changes such as ST elevation may indicate a heart attack, a widened QRS complex could point to a conduction block, and unusual T waves might suggest ischaemia or electrolyte imbalances.
Understanding P Waves in ECG Interpretation
When reviewing P waves in an ECG graph, carefully evaluate the following things:
- Are P waves clear on the ECG?
- Do the P waves look normal in shape, size, and direction?
- Does a QRS complex follow each P wave?
Note: If there is an irregular heart rhythm, and P waves are absent, it may indicate atrial fibrillation.
Understanding QRS Complex
While analysing a QRS complex in the ECG graph, notice the following things:
- Does the QRS complex look normal in shape and pattern*?
- Is the QRS complex of normal height?
- Is the QRS narrow (normal), narrowed (< 0.12 seconds), or widened (> 0.12 seconds)?
Understanding ST Segment
The ST segment is the part of the ECG that lies between the end of the S wave and the start of the T wave. In a healthy heart, this segment appears as a flat, isoelectric line, meaning it is neither elevated nor depressed. Any changes in the ST segment should be carefully assessed, as they may indicate underlying heart problems. In the ST segment, evaluate the following:
- Does the ST segment look normal?
- ST elevation, i.e., more than 1mm in 2 or more contiguous limb leads or more than 2mm in 2 or more chest leads, may indicate acute myocardial infarction (heart attack).
- ST depression, i.e., ≥ 0.5 mm in ≥ 2 contiguous leads, may suggest myocardial ischaemia.
Understanding T Waves
T waves represent the repolarisation (electrical resetting) of the ventricles after they contract.
T Waves are considered abnormally tall when they are more than 5mm in limb leads and more than 10mm in chest leads. Note the following points:
- If the T waves have 2 peaks (Biphasic T waves), this can be linked to ischaemia and hypokalaemia.
- If the T waves are flat, it indicates ischaemia or electrolyte imbalance.
When Should You Get Ambulatory ECG Monitoring?
In some cases, a standard ECG may not capture intermittent or underlying heart rhythm issues. If you continue to experience symptoms such as palpitations, dizziness, or unexplained discomfort, you may need an Ambulatory ECG Holter monitor to record your heart’s activity for 24 hours to 7 days, based on your doctor’s recommendations.
Bottom Line
Understanding how to read an ECG can give you valuable insight into your heart health, but accurate interpretation always requires expert review. If you’re experiencing symptoms or want reassurance, you can book your ECG appointment with Dr Francesco Lo Monaco, a leading cardiologist in London, for expert assessments and personalised heart care guidance.